One of the challenges associated with private equity investments is that managers can claim to be top-quartile investors by relying on certain metrics that may not show the full picture of the portfolio. Investors then need to understand key performance metrics to better make investment decisions.

Private equity is an asset class with the potential to generate a solid outperformance relative to the public markets. Due to the dispersion in the performance of private equity funds, however, understanding how this asset class can be assessed allows for a more thorough performance analysis.
One of private equity's defining features is the irregular timing of cash flows (whether in- or outflows) as committed capital may not be called upon immediately and estimating exit horizons with certainty can be difficult. As a consequence, private equity returns are often measured in different manners than other asset classes.
As a result, experts have adopted various metrics to give investors improved perspectives on their private equity investments' performance, and to benchmark them against investments in other asset classes.
I. Internal Rate of Return
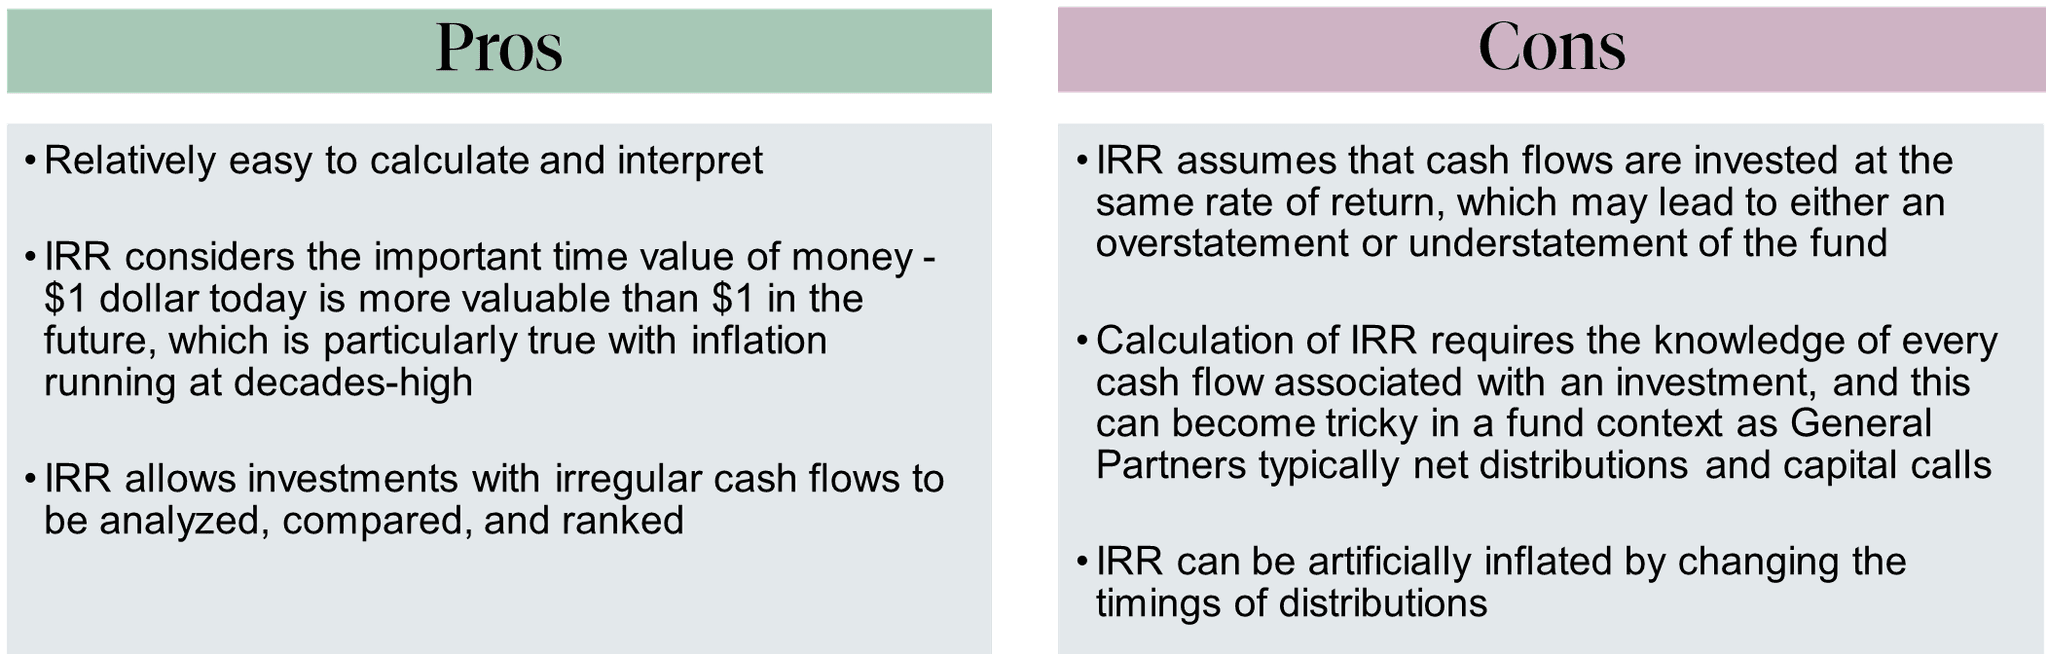
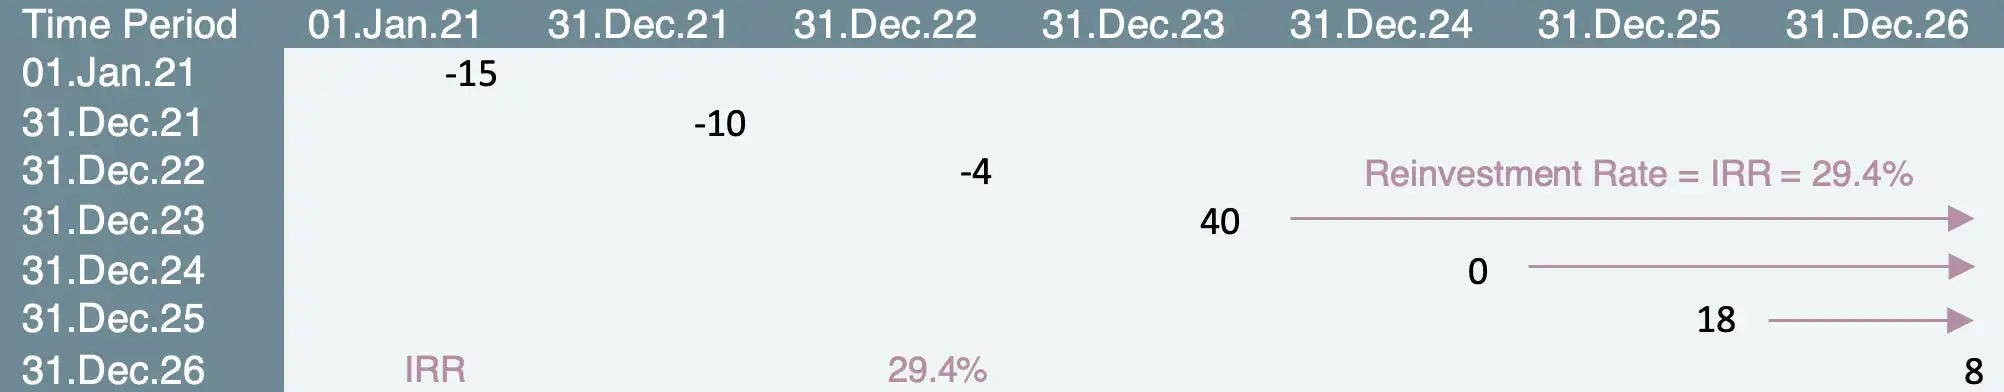
The Internal Rate of Return (IRR) is the most commonly used metric by professionals in the field as well as leading financial institutions, including the CFA Institute. IRR is defined as the implied annual rate of return on an investment, and if used as the discount rate, it renders the net present value (NPV) of an investment zero.
IRR simply calculates the earned “interest rate” on a series of withdrawals. As such, the size and timing of cash flows affect IRR calculation.
When analyzing or comparing IRR between funds, it is important to understand whether the reported IRR is gross or net of fees and carried interests, as there can be major differences between the two. Limited Partners often look at net IRR to know the actual returns they receive, while General Partners often use gross IRR in marketing materials.
 II. Performance Ratios
Private equity industry practitioners often use a set of three performance ratios to analyze and assess returns, all of which measure interim performance relative to the capital paid in the private equity investment or fund:
Distributions Divided by Paid-In Capital (DPI) - this ratio measures the portion of the paid-in capital that has been cumulatively distributed so far. For example, a DPI of 0.5x means that 50 cents have already been distributed to investors for every $1 they invested/contributed. DPI will be zero at the start of investment and will begin to increase as distributions get paid. When the DPI becomes equal to 1, it means that the fund has broken even, and any number above 1 indicates that the fund has paid out more than what was initially invested.
Residual Value (aka NAV) divided by Paid-In Capital (RVPI) - As the term suggests, RVPI is the portion of the value of the investment/fund that is unrealized. It is high at the beginning (as most investments are yet to be realized/harvested); as the investments are exited, RVPI decreases to zero. For instance, an RVPI of 0.6x means that the remaining investments are valued at 60 cents for every $1 dollar invested.
- Total Value divided by Paid In capital (TVPI) - the Total Value consists of both distributions and residual value, that is TVPI = RVPI + DPI. A TVPI of 1.45x, for example, means that the investment has created a total gain of 45 cents for every $1 dollar invested
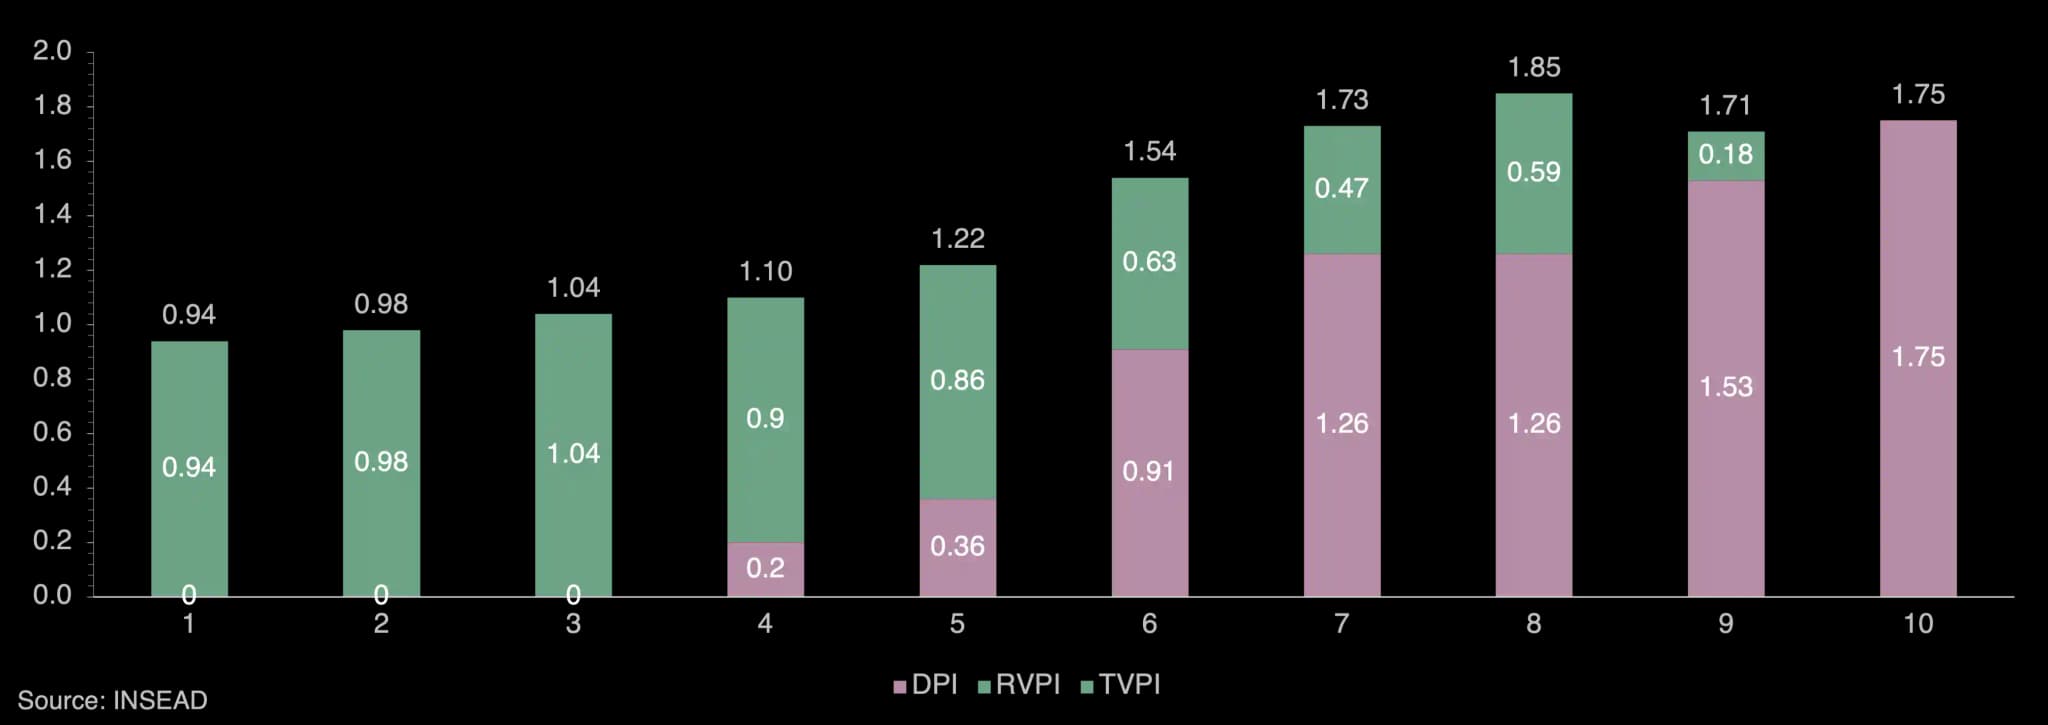
To illustrate an example, the graph above reflects the dynamics of the three multiples (DPI, RVPI, and TVPI) over the life of a private equity fund/investment.TVPI is often <1 in year 1 due to upfront fees related to management and fund setting
In the early years of the investment period, most (if not all) investments are unrealized or unharvested; hence, RVPI is equal to TVPI which indicates that DPI is equal to zero
As the fund progresses and distributions are made, DPI grows and in the case of the sample fund shown above, the first value realization occurred in the 4th year
The share of the fund’s DPI continues to rise to become equal to the TVPI when all investments have been realized or exited
Why use both IRR and Performance Multiples?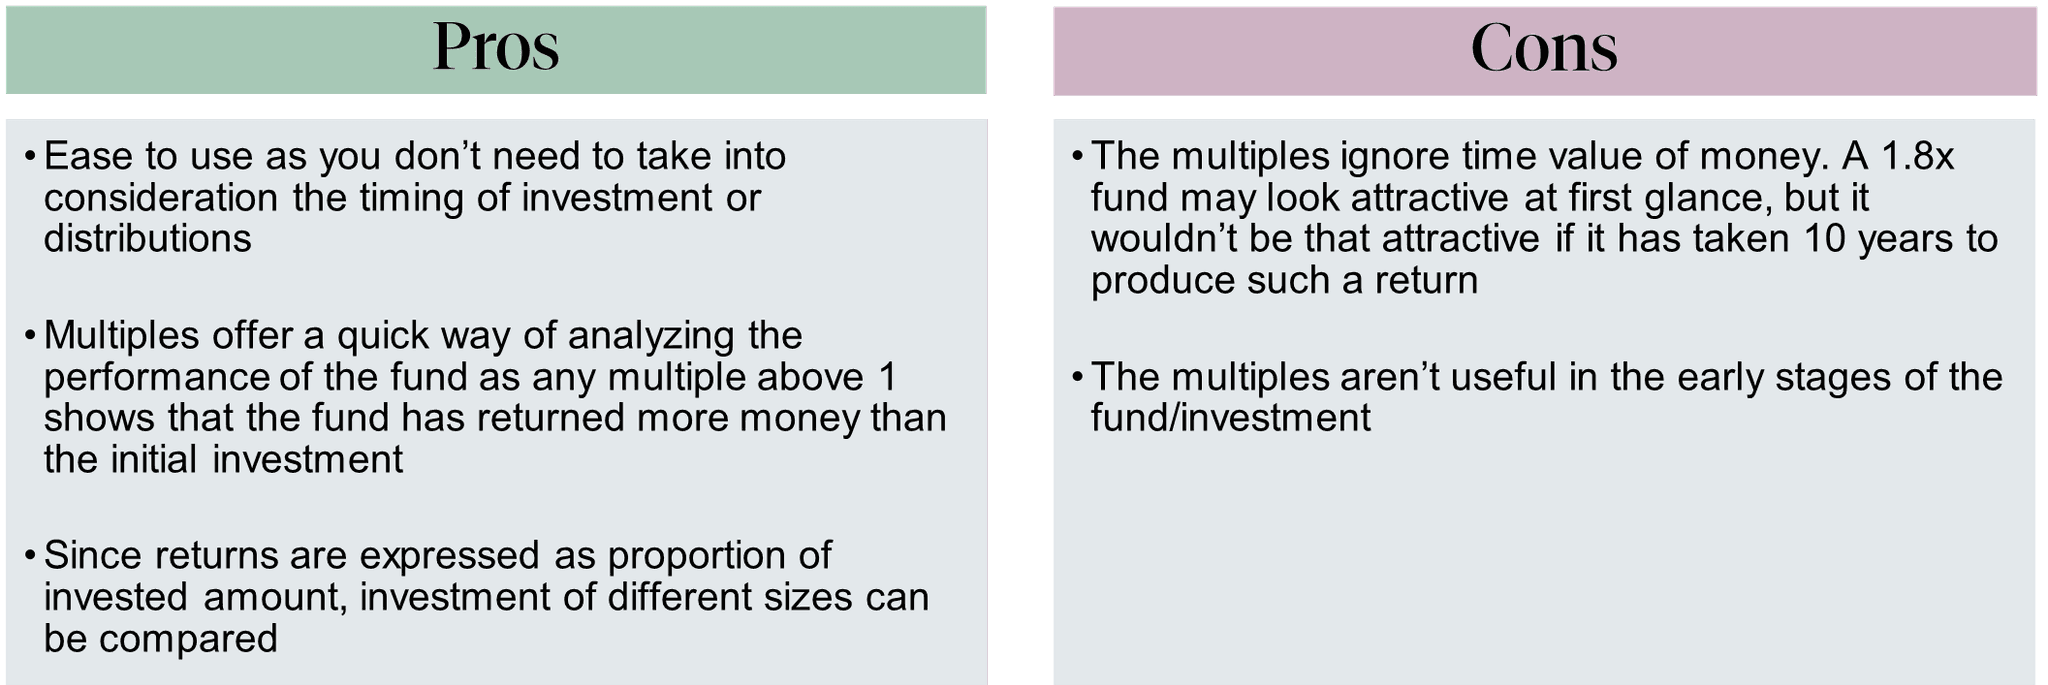
IRR and Performance Multiples are two important analysis tools on their own. IRR incorporates the time value of money but is not sufficient in defining an investment’s absolute return, which is a perspective covered by the multiples. When used together, they provide better insights on the potential benefits of private equity investments.
III. Relative Performance Indicators
Public Market Equivalent (PME)
The performance of public investments is measured on the basis of time-weighted returns which aren’t particularly comparable to the IRR of private investments. In an attempt to address this, Public Market Equivalent is created where an investment in a private equity fund is compared to an equivalent investment in a public benchmark (i.e., S&P 500, Dow Jones). The PME is generated by establishing a hypothetical investment that purchases and sells shares in the selected public market in a way that mimics the private equity fund cash flows. For example, if a $50m drawdown was made by the private equity fund, then $50m will be hypothetically invested in the public market index which will yield two directly comparable IRRs.
If the IRR of the private equity investment is greater than the IRR of the private market equivalent, then the fund can be considered to have outperformed.
PME+
PME+ is an adjustment to PME that was developed to address the short exposure problem that can be present in the PME calculation if large distributions are made. It does so by scaling distributions with a factor called lambda until the final valuation of the private market index is equivalent to the NAV of the private equity.
IV. Conclusion
By approaching private equity performance analysis with IRR, Multiples, PME, and industry context, investors can better analyze how quickly investments saw returns, the absolute returns of an investment, and how did the investments fair against the public market.
Petiole's transparent portfolio reporting and thorough deal selection provide investors with world-class investment analysis. Contact our team to learn how we assess fund performance and our investment approach today.
References:
Private Equity Performance Measurement, BVCA Perspectives Series, 2015
Measuring Private Equity Fund Performance, Alexandra Albers-Schoenberg, INSEAD Background Note, February 2019
How to Analyze Private Equity Performance, Catherine Cote, Harvard Business School, 17 August 2021
The Keys to Unlocking Private Equity Portfolio Assessment, Gary Robertson, Callan Institute, July 2019